
The top 5 states for solar energy in 2025 are California (49% solar electricity, $111.9B market value), Texas (41.4 GW capacity, $50.1B market, #1 for utility-scale), Florida (18.6 GW capacity, 2nd in residential), Nevada (38.3% solar electricity, 2nd highest penetration rate), and North Carolina (9.6 GW capacity, 4th in utility-scale). Solar power in the U.S. has grown from 1.2 billion kWh in 2010 to over 90.1 billion kWh in 2020, making it one of America’s fastest-growing energy sources as the nation targets 100% pollution-free electricity by 2035.
Quick Answer Summary:
#1 California: 49% solar electricity generation, $111.9 billion market value, 300+ sunny days annually
#2 Texas: 41.4 GW installed capacity, leads nation in utility-scale installations, $50.1 billion market (projected #1 in 5 years)
#3 Florida: 18.6 GW total capacity, 2nd for residential installations, 45% growth in new systems (2021)
#4 Nevada: 38.3% solar electricity (2nd highest penetration nationally), strong policy support
#5 North Carolina: 9.6 GW installed, 4th for utility-scale, 7% of state electricity from solar
Best states by category:
- Total capacity leader: California ($111.9B market, 49% solar electricity)
- Fastest growing: Texas (adding 41 GW, $50.1B market value)
- Best residential market: Florida (2nd nationally, 130,947+ systems installed)
- Highest solar penetration: Nevada (38.3% of total electricity from solar)
- Best community solar: North Carolina (extensive cooperative and municipal programs)
Top incentives by state (2025):
- California: Property tax exemptions, tax breaks for installations, early regulations since 1976
- Texas: Leading utility-scale infrastructure, $50.1B market investment
- Florida: Rapid residential expansion (41% capacity growth in 2021)
- Nevada: High penetration policies, effective state renewable energy standards
- North Carolina: Solar Property Tax Exemption with substantial income tax credits
Key factors for ranking: Total installed capacity (measured in GW), solar electricity percentage, market value, residential vs. utility-scale installations, annual sunshine hours, state incentive programs, property tax exemptions, net metering policies, and community solar accessibility. Homeowners in top solar states achieve payback periods of 6-12 years with 25-30 years of free electricity generation afterward.
Additional high-performing states: Arizona (8.5% solar electricity, $14.3B invested, 6-8 year payback), Massachusetts (highest per-capita solar quotes, SMART program), New Jersey and Maryland (strong East Coast policies).

Which States Are Winning the Solar Race?
As the solar industry continues its upward trajectory, five states have emerged as clear frontrunners in solar adoption and production:
- California
- Texas
- Florida
- Nevada
- North Carolina
California: The Undisputed Solar Champion
California maintains its position as the nation’s solar powerhouse, leading in both total production capacity and percentage of solar-generated electricity. The Golden State remains the dominant force, outpacing all competitors in overall solar output. Solar energy now accounts for approximately 49% of California’s electricity generation, a staggering figure that reflects the state’s abundance of sunshine, with around 300 sunny or partly sunny days annually.
California’s renewable energy ambitions are unmatched: targeting 60% renewable energy by 2030 and complete carbon-free power by 2045. As a pioneer in solar adoption since implementing green energy regulations in 1976, the state has cultivated a mature solar ecosystem. With a solar market valued at $111.9 billion and strategic incentives including tax credits and property tax exemptions for solar installations, California continues setting the national standard. Understanding the complete solar permit application process is crucial for homeowners looking to join this renewable energy movement.
Texas: The Rapidly Rising Solar Giant
Texas has positioned itself as a powerhouse in solar development and installation infrastructure. The Lone Star State ranks second nationally with 41.4 GW of total installed solar capacity and leads the nation in utility-scale installations. Texas added 1,525 megawatts of new solar capacity in 2021, representing 45% of its entire 2020 installation volume.
With a solar market worth $50.1 billion and projections indicating an additional 41 GW coming online, Texas is poised to claim the top spot within five years. This aggressive expansion makes Texas the state to watch in America’s solar transformation. For businesses considering commercial solar design, Texas offers unparalleled opportunities for utility-scale projects.
Florida: The Sunshine State Lives Up to Its Name
Florida ranks third nationally with over 18.6 GW of total solar capacity installed, securing second place for residential installations and third for utility-scale projects. In 2021 alone, Florida connected 40,395 new residential solar systems, adding approximately 342 MW to state capacity. This brought the total residential solar portfolio to 130,947 systems, representing just under 1.2 GW of capacity.
Compared to 2020’s figures of 90,552 systems generating 835 MW, the 2021 additions represented nearly 45% growth in new installations and roughly 41% capacity expansion. This explosive residential solar growth shows no signs of slowing, cementing Florida’s position as a top-tier solar state. Homeowners wondering about home solar system costs in 2025 will find Florida’s competitive market particularly attractive.
Nevada: Exceptional Solar Penetration Leader
Nevada secures its position in the top five by producing 38.3% of its electricity from solar energy, ranking second in the nation for solar as a percentage of total electricity generation. While the Silver State may not lead in total capacity, its impressive solar penetration rate demonstrates how effectively smaller states can leverage their natural resources and supportive policies.
Nevada’s commitment to solar energy showcases that success isn’t measured solely by gigawatts installed but also by how thoroughly solar power integrates into a state’s energy portfolio. This high penetration rate reflects strong state policies, abundant sunshine, and a forward-thinking approach to renewable energy adoption.
North Carolina: The Eastern Solar Powerhouse
North Carolina has established itself as a solar leader on the East Coast, ranking fifth nationally with 9.6 GW of installed capacity and fourth for utility-scale projects. Solar power now generates over 7% of the state’s electricity, significantly above the national average of just over 2%.
The state’s Solar Property Tax Exemption policy delivers substantial income tax credits that incentivize both residential and commercial solar adoption at unprecedented rates. Community solar programs, particularly prevalent in cooperative and municipal utility territories, provide accessible renewable energy options for residents unable to install their own systems. North Carolina proves that southeastern states can compete with western solar giants through smart policy and community engagement. Navigating AHJ solar requirements can be complex, but North Carolina’s streamlined processes help accelerate installations.
Additional States Making Solar Strides
While the top five states dominate solar capacity and production, several other states are making impressive progress in renewable energy adoption. For more insights on solar trends nationwide, explore our solar energy blog.
Arizona: Desert Sun Powerhouse
Arizona ranks as one of the nation’s largest solar investors with over $14.3 billion committed to solar development. The Grand Canyon State’s dedication is paying dividends, solar now provides more than 8.5% of Arizona’s total electricity supply. With over 300 sunny days annually, Arizona offers ideal conditions for solar generation. Homeowners benefit from a $1,000 state tax credit combined with federal incentives, achieving payback periods of just 6-8 years. The state boasts over 306 solar companies, collectively sustaining more than 7,000 solar industry jobs.
Massachusetts: Leading Residential Adoption
Massachusetts tops the nation for homeowners per capita requesting solar quotes in 2025. High electricity rates combined with the SMART incentive program create compelling savings opportunities for residents, proving that northern states can successfully compete in solar adoption. Homeowners debating professional solar panel installation vs DIY should carefully weigh local regulations and incentive requirements.
New Jersey and Maryland: East Coast Contenders
New Jersey delivers robust financial incentives and supportive policies for residential solar adopters. Maryland strengthens its position through solid net metering policies, tax exemptions, and expanding community solar programs.

America’s Solar Future: Accelerating Toward Clean Energy
The explosive growth of solar energy across these leading states demonstrates a fundamental shift toward sustainable, renewable power generation. These pioneers not only showcase solar’s vast potential but establish blueprints for other states to replicate. With ambitious federal targets and surging investments in solar technology, the United States is making tangible progress toward 100% pollution-free electricity by 2035.
This solar surge, powered by technological innovation, supportive legislation, and rising environmental consciousness, reflects America’s serious commitment to addressing climate change and building a cleaner energy infrastructure. The solar revolution underway today isn’t merely a passing trend but a critical foundation for ensuring sustainable energy security for future generations. Whether you’re exploring off-grid solar system design or grid-connected solutions, the time to act is now.
Take action now to join this renewable energy movement and contribute to a cleaner, more sustainable tomorrow.
Solar Permit Solutions
Affordable Solar Permit Plans
Don't let permit costs slow your project. Professional plan sets at competitive prices — all 50 states, fast turnaround.
Conclusion
The solar energy revolution sweeping across America presents an unprecedented opportunity for homeowners, businesses, and communities to embrace clean, cost-effective power while contributing to national climate goals. Whether you’re in California’s mature solar market, Texas’s rapidly expanding landscape, Florida’s booming residential sector, Nevada’s high-penetration environment, or North Carolina’s community-focused programs, the time to act is now.
Each of the top five states offers unique advantages, from California’s comprehensive incentive programs and $111.9 billion market to Nevada’s exceptional 38.3% solar penetration rate and North Carolina’s robust tax exemption policies. The key is understanding your state’s specific benefits, available tax credits, net metering policies, and payback timelines. As solar technology becomes more efficient and affordable, and with the federal government’s commitment to achieving 100% pollution-free electricity by 2035, going solar has never been more accessible or impactful.
Don’t wait for tomorrow to secure your energy independence. Research your state’s solar incentives, request quotes from certified installers, and take the first step toward reducing your carbon footprint while lowering your electricity bills. For comprehensive solar design and permitting services, partnering with experienced professionals can help you avoid common solar permit denials and design mistakes. The solar future is here, make sure you’re part of it.
FAQs
Can I benefit from solar energy if I can’t install panels on my property?
Yes, community solar programs offer an excellent alternative for renters, apartment dwellers, or homeowners with properties unsuitable for solar panel installation. These programs allow multiple participants to share the benefits of a larger solar array located elsewhere, receiving credits on their electricity bills proportional to their subscription. North Carolina has particularly strong community solar offerings, especially in cooperative and municipal utility areas, which contributes to its fifth-place national ranking. Maryland also promotes community solar programs as part of its renewable energy strategy. Additionally, states like Massachusetts and New Jersey are expanding community solar access to ensure more residents can participate in the clean energy transition regardless of their living situation.
Is solar energy worth it if I don’t live in one of the top five solar states?
Absolutely. While California, Texas, Florida, Nevada, and North Carolina lead in capacity and production, solar energy can be financially beneficial and environmentally impactful regardless of location. Arizona, despite not ranking in the top five for total capacity, has invested over $14.3 billion in solar and offers excellent homeowner incentives with 6-8 year payback periods. Massachusetts, despite less sunshine than southwestern states, leads the country in homeowners per capita requesting solar quotes due to high electricity rates and excellent incentive programs. New Jersey and Maryland also offer compelling financial returns through strong policies and incentives. The key factors are your local electricity rates, available state and federal incentives, net metering policies, and your home’s sun exposure. Contact Solar Permit Solutions for expert guidance on streamlining your solar permit processing and to determine your specific savings potential, you may be surprised at how feasible solar is, even outside the top-ranked states.
Affordable Solar Permit Plans
Don't let permit costs slow your project. Professional plan sets at competitive prices — all 50 states, fast turnaround.
Frequently Asked Questions
California remains the undisputed leader in solar energy production, generating approximately 49% of its electricity from solar sources. The state's solar market is valued at an impressive $111.9 billion, far exceeding any other state. California's combination of abundant sunshine (around 300 sunny days annually), early adoption of solar-friendly regulations dating back to 1976, and generous tax incentives has created the nation's most robust solar ecosystem. Texas follows in second place with 41.4 GW of installed capacity and is projected to challenge California's dominance within the next five years.
Financial incentives vary significantly by state but typically include federal tax credits, state tax credits, property tax exemptions, and net metering programs. Arizona offers a $1,000 state tax credit plus federal incentives, resulting in payback periods of just 6-8 years. Massachusetts provides the SMART (Solar Massachusetts Renewable Target) incentive program that creates substantial savings when combined with high local electricity rates. North Carolina's Solar Property Tax Exemption delivers sizeable income tax credits for both residential and commercial installations. California offers property tax exemptions and tax breaks for solar installations. Most states also offer net metering, allowing homeowners to sell excess electricity back to the grid, further reducing costs.
Solar panel payback periods typically range from 6 to 12 years, depending on your state's sunshine hours, electricity rates, available incentives, and installation costs. States like Arizona offer some of the fastest payback periods at 6-8 years due to abundant sunshine and strong incentive programs. Massachusetts homeowners also enjoy relatively quick returns thanks to high electricity rates and the SMART program, which make solar savings more substantial. Florida homeowners benefit from the state's explosive residential solar growth and competitive installation market. States with lower electricity rates or fewer incentives may see longer payback periods of 10-12 years. After the payback period, solar panels continue generating free electricity for the remainder of their 25-30 year lifespan, representing significant long-term savings.
Yes, community solar programs offer an excellent alternative for renters, apartment dwellers, or homeowners with properties unsuitable for solar panel installation. These programs allow multiple participants to share the benefits of a larger solar array located elsewhere, receiving credits on their electricity bills proportional to their subscription. North Carolina has particularly strong community solar offerings, especially in cooperative and municipal utility areas, which contributes to its fifth-place national ranking. Maryland also promotes community solar programs as part of its renewable energy strategy. Additionally, states like Massachusetts and New Jersey are expanding community solar access to ensure more residents can participate in the clean energy transition regardless of their living situation.
Absolutely. While California, Texas, Florida, Nevada, and North Carolina lead in capacity and production, solar energy can be financially beneficial and environmentally impactful regardless of location. Arizona, despite not ranking in the top five for total capacity, has invested over $14.3 billion in solar and offers excellent homeowner incentives with 6-8 year payback periods. Massachusetts, despite less sunshine than southwestern states, leads the country in homeowners per capita requesting solar quotes due to high electricity rates and excellent incentive programs. New Jersey and Maryland also offer compelling financial returns through strong policies and incentives. The key factors are your local electricity rates, available state and federal incentives, net metering policies, and your home's sun exposure.
SPS Editorial Team
Solar Permit Solutions
Solar Permit Solutions provides professional solar permit design services for residential, commercial, and off-grid installations across all 50 states. Our team ensures permit-ready plan sets delivered fast.
Related Articles
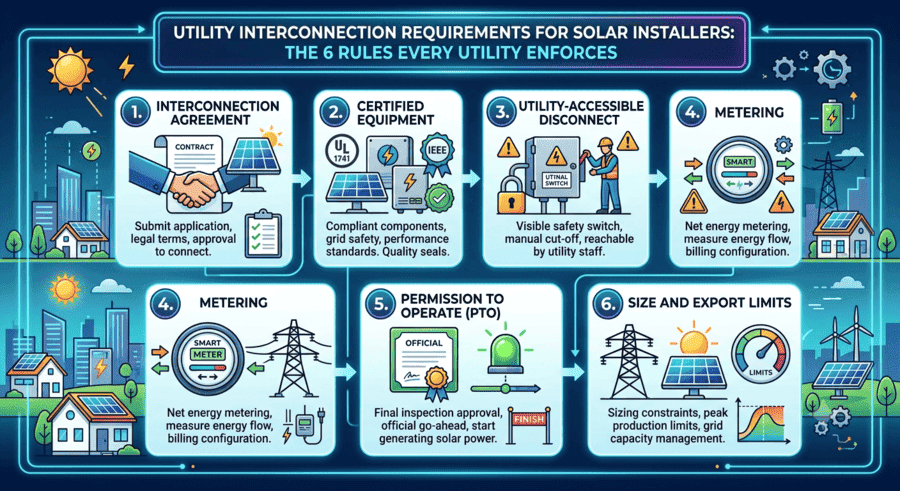
Utility Interconnection Requirements for Solar Installers: The 6 Rules Every Utility Enforces
interconnection agreement, UL 1741 and IEEE 1547 certified inverters, a utility-...

How to Respond to Solar Permit Corrections (And Get Approved on Resubmission)
To respond to a solar permit correction, read every comment from every reviewing...

Can an EV Charging Station Be Powered by Solar? Here’s How to Build One
Yes, an EV charging station can be powered by solar. A grid-tied solar array pai...