How Much Do Home Solar Panels Cost In 2025? Complete U.S. Pricing Guide
|
16 min read
Solar panels cost $30,000 to $42,000 for a typical 12kW residential system in 2025, with an average of $34,200 before incentives. Most homeowners recover this investment in 10.5 years and save $37,000 to $148,000 over 25 years through reduced electricity bills.
Key Cost Factors: System size (12kW average), location (prices range from $2.38/W in Arizona to $3.57/W in Hawaii), roof complexity, equipment quality, and available local incentives determine final pricing. Installation costs average $2.85 per watt nationally before incentives according to federal benchmarks.
Financial Benefits: Solar panels eliminate or significantly reduce monthly electricity bills, provide protection against rising utility rates (which increase 3-5% annually), and typically generate free electricity for 25-30 years after the payback period. With current financing options, many homeowners achieve positive cash flow immediately when monthly energy savings exceed loan payments.
2025 Market Conditions: Solar prices have reached historic lows this year, making it optimal timing for installation. Federal tax credits remain available but have limited installer capacity through year-end. State and local programs can reduce total costs by thousands, with some areas offering rebates that cut installation prices by 30-50%.
Essential Solar System Specifications And Investment Overview
A standard residence needs approximately 12 kilowatts (kW) of solar capacity to fulfill electricity demands, averaging $34,200 prior to incentive applications. Various locations offer state and local initiatives that reduce prices by thousands, and loan financing often enables homeowners to achieve positive cash flow immediately when energy savings surpass monthly payments. Understanding system costs helps make informed decisions.
Analyzing solar expenses requires examining factors beyond initial pricing. Current installations average roughly $2.85 per watt before incentive applications. These figures fluctuate based on geographical location, roofing features, and selected equipment. State-specific averages provide more relevant information than nationwide statistics, with elements including shade coverage, roofing complexity, and regional incentive offerings influencing final pricing.
Standard 12 KW System Investment Ranges For 2025
Pricing Before Available Incentives:
Low range: $30,000
Average: $34,200
High range: $42,000
Regional Solar Investment Variations By State
Residents in warmer climates requiring substantial air conditioning typically need larger solar arrays. Solar design services generally offer reduced per-watt rates for bigger installations, potentially lowering unit costs significantly.
This pricing pattern commonly appears across states, with lower per-watt costs in warmer regions and higher pricing in cooler areas. Arizona shows the lowest average solar expenses, whereas Wyoming and Nebraska display higher pricing. However, larger system requirements in hot Arizona compared to cooler Maine and New Hampshire often result in comparable overall investments. Recent market analysis confirms these regional variations.
Comprehensive State Pricing And Savings Data
Breaking Down Total Solar System Expenses
Solar installation pricing involves numerous factors beyond panel costs. Understanding business operational expenses helps explain installer pricing structures. Working with professional services ensures accurate cost assessment.
Installation Cost Distribution Analysis
Hardware And Equipment Pricing Details
While panels represent the most recognizable solar component, they constitute less than one-third of equipment expenses. Total required solar equipment, including supply chain and tax considerations, averages $15,732, approximately 46% of complete system pricing. Latest utility-scale data shows similar cost distributions.
Equipment costs vary based on brand selection and quality standards. Premium equipment often delivers superior long-term savings, though the most expensive options rarely provide optimal value. Multiple quality manufacturers offer products across various price ranges.
Panel selection directly influences installation quality. Monocrystalline panels provide maximum efficiency and power generation, making them standard for residential installations. Though typically pricier than polycrystalline alternatives, fewer monocrystalline panels achieve equivalent power output, potentially equalizing total costs. Thin-film panels offer the most economical option but lack sufficient production for standard home installations, serving better for recreational vehicles and DIY projects.
Inverter expenses can match panel costs depending on selected technology. These devices transform direct current from panels into alternating current for household use. Microinverters and optimized inverters share similar pricing, exceeding string inverters by several thousand dollars. Complex roofs featuring multiple sections or shade coverage benefit from premium microinverter or optimized inverter investments to maximize production. Understanding wire sizing requirements helps optimize system performance.
Mounting hardware secures panels to roofs, representing a minor expense portion. Electrical connections linking rooftop systems to grid infrastructure and electrical panels contribute several thousand dollars additionally.
Professional Installation Service Costs
Solar installation providers establish varying service rates. Final pricing reflects company reputation, warranty provisions, and operational structure. Established installers offering comprehensive warranties typically charge premium rates, often justifying the additional investment. For specialized projects, commercial design expertise becomes essential.
Installation company expenses roughly equal equipment costs at approximately $15,732, representing 46% of total installation pricing. Labor comprises merely 7% of installer expenses, with profit margins around 11%. Primary installer expenses include sales, marketing, and operational overhead.
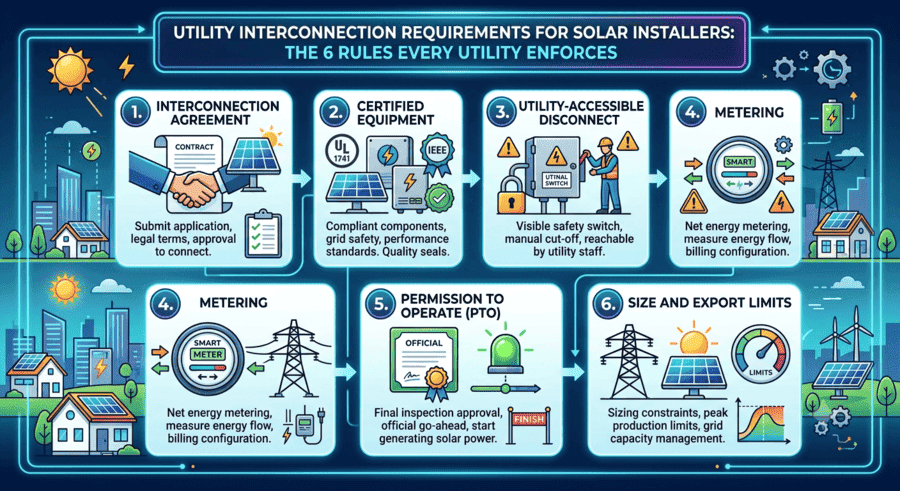
Documentation And Interconnection Fees
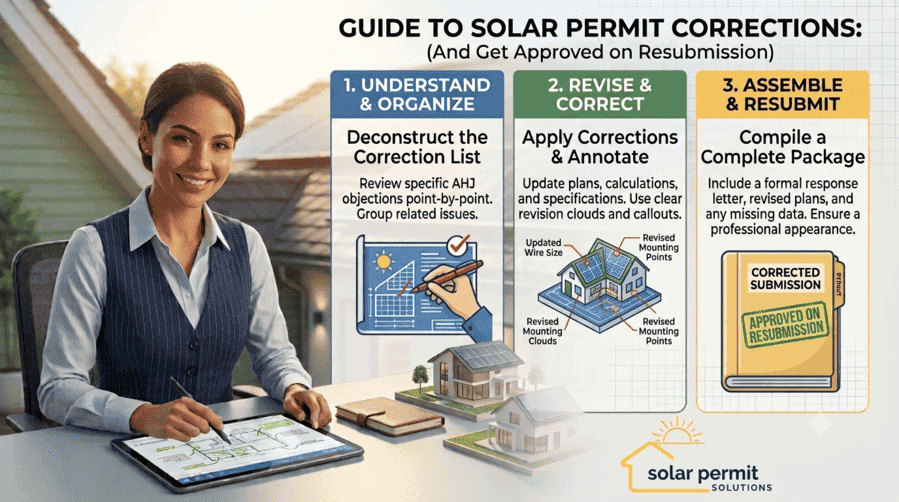
Documentation and fees contribute several thousand dollars to installations, representing approximately 8% of total expenses. Solar installations require various permits, typically managed by installation companies. Grid interconnection fees cover the process of connecting solar systems to utility infrastructure. Understanding permit requirements streamlines the process.
Progressive initiatives work toward reducing costs and accelerating interconnection timelines. The Department of Energy’s SolarApp+ program seeks to streamline and economize the interconnection process nationwide. Recent laboratory publications detail these improvements.
Solar Permit Solutions
Affordable Solar Permit Plans
Don't let permit costs slow your project. Professional plan sets at competitive prices — all 50 states, fast turnaround.
Key Variables Influencing Solar Installation Pricing
Beyond equipment and installer selection, pricing depends substantially on electricity consumption patterns and property features. Required system capacity, roofing characteristics, and geographical location significantly influence solar expenses. Permit timelines also affect project costs.
Size Requirements And Scaling Economics
The relationship remains straightforward: Larger solar installations generate increased electricity while requiring greater investment. However, bulk purchasing principles apply, where expanded systems typically feature reduced per-watt averages, similar to wholesale buying where total costs increase but unit prices decrease. Industry cost analysis confirms this trend.
Property Characteristics And Installation Complexity
Installation complexity affects pricing structures. Greater direct sunlight exposure reduces panel requirements for complete electricity coverage. South-facing roofs sloping at 30-degree angles with unobstructed sunlight provide ideal, cost-effective installation conditions.
Roofs featuring multiple sections, dormers, or skylights increase equipment and labor requirements, elevating expenses. Large trees creating shade add $300 to $1,500 for removal or trimming services. Using proper installation tools ensures quality workmanship.
Electrical panels represent another crucial installation component often overlooked. Solar installations sometimes necessitate panel upgrades or rewiring, potentially adding several thousand dollars. Generally, electrical panels should provide minimum 200-amp capacity for solar compatibility. Open database resources provide additional technical specifications.
Location-Based Pricing Factors
Installation expenses vary regionally. Certain locations require expanded systems for equivalent energy production compared to areas receiving greater daily sunlight. Some regions experience higher electricity demands from temperature extremes. Various areas provide enhanced incentives, including state rebates and tax credits substantially reducing expenses. Latest market reports track regional variations.
Return On Investment Analysis For Solar Systems
Solar installations prove worthwhile for most property owners through electricity bill elimination or substantial reduction. Viewing solar panels as investments provides proper perspective. Recovery periods average 10.5 years for installation expenses. Following this point, solar electricity becomes cost-free.
Property owners typically save between $37,000 and $148,000 over 25 years through solar adoption. Savings depend on electricity rates and system expenses. Calculate break-even points by dividing final costs (total system expense minus upfront incentives) by annual financial benefits (electricity savings plus yearly incentives). Rising electricity rates accelerate payback periods and increase total savings.
Declining solar prices create shorter recovery periods. A decade ago, residential solar installations cost $3.36 per watt according to research laboratories, representing 28% higher pricing than current rates. Solar costs experienced slight increases over three years, primarily from pandemic-related equipment shortages affecting multiple industries. However, 2025 presents historically low solar pricing, creating optimal timing for obtaining quotations. Recent technical documentation confirms pricing trends.
Financial Incentives And Rebate Programs
Tax credits, cash rebates, net metering, performance-based incentives, and solar renewable energy credits provide financial returns on installations. Incentive eligibility varies by location, with utilities, municipalities, and states offering programs within their service territories. Contact specialists for guidance on available programs.
Post-Installation Expenses And Maintenance Factors
Solar installations shouldn’t involve hidden expenses, though several supplementary costs merit consideration. Understanding insurance implications helps protect investments.
Ongoing System Upkeep Costs
Solar panels demand minimal maintenance throughout operational lifespans, limiting post-installation expenses. Stronger equipment and labor warranties reduce concerns. Leading solar manufacturers currently provide comprehensive 25-year coverage. Educational resources offer maintenance guidance.
Situations beyond warranty coverage occasionally arise. Tree growth may require trimming, or heavy pollution areas might necessitate cleaning services. Latest industry analysis discusses maintenance best practices.
Roofing Considerations Before Installation
Solar panels operate effectively for three decades. Pre-installation roof assessments ensure comparable longevity. Asphalt roofs exceeding 5 to 10 years typically require replacement before solar installation. Recent utility research emphasizes structural considerations.
Financing Methods And Purchase Strategies
Payment methods influence total expenses and long-term savings. Three primary solar financing approaches exist. Visit Solar Permit Solutions for personalized financing guidance.
Cash Purchase: Upfront payment eliminates interest charges while maximizing long-term savings. Immediate ownership provides access to available state or local incentives.
Solar Financing: Loans suit those avoiding upfront payments while valuing ownership. Certain solar loans require no down payment, enabling immediate savings. System ownership qualifies for available incentives, though interest payments reduce overall savings compared to cash purchases.
Lease Agreements: Solar leases or power purchase agreements benefit those maintaining capital flexibility for alternative investments or lacking state incentive access. These arrangements require zero initial payment with companies handling maintenance. Since lease and PPA installations qualify for federal tax credits, competitive providers transfer savings through reduced monthly rates. While long-term savings typically fall below ownership benefits, capital preservation and immediate electricity bill reductions begin instantly. Explore blog resources for additional insights.
Conclusion
Solar panel installation represents a significant financial decision that extends far beyond initial pricing considerations. With average systems costing approximately $34,200 before incentives, the investment may appear substantial at first glance. However, the comprehensive analysis reveals that solar energy systems deliver exceptional long-term value through decades of electricity generation and protection against rising utility rates.
The current solar market presents historically favorable conditions for homeowners considering renewable energy adoption. Pricing has reached competitive levels while technology continues advancing, offering improved efficiency and reliability. State-specific variations in costs and incentives create unique opportunities depending on geographic location, making personalized assessment essential for accurate investment evaluation.
Property owners who conduct thorough research, compare multiple installation providers, and leverage available incentives position themselves for optimal returns. The combination of immediate electricity savings, increasing property values, and environmental benefits creates a compelling case for solar adoption. As utility rates continue their upward trajectory and solar technology becomes increasingly affordable, the question shifts from whether to install solar panels to when represents the most strategic timing.
Taking action toward solar energy independence requires careful consideration of system sizing, equipment quality, financing options, and installation timing. Those who proceed with well-informed decisions typically experience payback periods under 11 years, followed by decades of free electricity generation. This transformative investment not only reduces monthly expenses but also contributes to energy independence and environmental sustainability for future generations.
FAQs
All 50 StatesFast TurnaroundPE Stamped Plans
Affordable Solar Permit Plans
Don't let permit costs slow your project. Professional plan sets at competitive prices — all 50 states, fast turnaround.
Currently accepting new projects — 2–5 day turnaround
Most reputable solar installations include transparent pricing without hidden fees. However, homeowners should budget for potential additional expenses including tree trimming for shade removal ($300-$1,500), electrical panel upgrades if current capacity falls below 200 amps (several thousand dollars), and roof replacement if existing roofing exceeds 10 years old. Regular maintenance remains minimal, though occasional cleaning services might prove necessary in areas with heavy pollution or pollen accumulation.
The average payback period for residential solar installations spans approximately 10.5 years, though this timeline varies significantly based on local electricity rates, system costs, and available incentives. Properties in states with high electricity costs and strong solar incentives often achieve payback in 6-8 years, while areas with lower rates might extend to 12-15 years. After reaching the break-even point, systems continue generating free electricity for their remaining 15-20 year lifespan.
The optimal payment method depends on individual financial situations and goals. Cash purchases eliminate interest charges and maximize long-term savings while providing immediate ownership and incentive eligibility. Solar loans enable ownership without large upfront investments, though interest reduces overall returns. Leasing arrangements preserve capital and provide immediate savings but typically yield lower long-term benefits compared to ownership options. Most financial advisors recommend ownership through cash or financing for maximum investment returns.
Typical residential properties need approximately 12 kilowatts of solar capacity to offset annual electricity consumption fully. This translates to roughly 30-35 panels depending on individual panel wattage. Actual requirements vary based on household electricity usage, local climate conditions, roof orientation, and shading factors. Properties in warmer climates with extensive air conditioning needs often require larger systems, while energy-efficient homes in moderate climates might need smaller installations.
Solar pricing has reached historically low levels in 2025, with average costs at $2.53 per watt before incentives, representing significant reductions from previous years. While pandemic-related supply chain disruptions temporarily increased prices, current market conditions offer exceptional value. Combined with expiring federal tax credits and rising electricity rates, present conditions create compelling urgency for solar adoption. Waiting typically results in higher installation costs and missed savings opportunities from delayed energy production.
Share:
SPS Editorial Team
Solar Permit Solutions
Solar Permit Solutions provides professional solar permit design services for residential, commercial, and off-grid installations across all 50 states. Our team ensures permit-ready plan sets delivered fast.