
Solar panel payback period in California ranges from 5 to 10 years, with an average of 7.5 years. This is the time it takes for your solar system to pay for itself through energy bill savings and incentives.
- Average payback: 7.5 years
- Fastest payback: 4-5 years (high-rate areas like San Diego)
- Typical range: 5-10 years statewide
- Key factor: California’s $0.29/kWh average electricity rate (71% above national average)
Calculation Example: A 5kW solar system costing $11,401-$13,111 before incentives drops to $7,981-$9,177 after the 30% federal tax credit. With $2,000 annual electricity savings, your payback period is approximately 4-4.6 years.
What affects your payback period:
- System installation cost ($2.28-$3.14 per watt in California)
- Local electricity rates (San Diego: $0.47/kWh vs Los Angeles: $0.23/kWh)
- Federal tax credit (30% ITC saves $5,400 on an $18,000 system)
- California SGIP rebates ($200-$1,000 per kWh for battery storage)
- Annual energy production (varies by location and roof conditions)
- Household energy consumption levels
California’s combination of high electricity costs, abundant sunshine, and generous incentives creates one of the fastest solar payback periods in the United States. Most homeowners see complete return on investment within a decade while generating over $115,000 in lifetime savings.

Key Variables Affecting California Solar Payback
Your solar payback timeline depends on multiple cost factors and essential elements. Understanding these variables helps you make informed decisions about your solar investment and set realistic expectations for your return on investment. Here’s what matters:
Power Costs
California’s electricity prices rank among America’s highest at $0.29 per kWh on average, 71% above the national figure. Cities like San Diego see rates approaching $0.47/kWh. Bottom line? Solar delivers greater savings here, accelerating your payback timeline.
Solar Installation Expenses
California solar installations average $2.28 to $3.14 per watt. A standard 5kW setup costs between $11,400 and $15,700. Securing lower pricing through professional solar panel installation means reaching payback sooner.
Financial Programs and Credits
California offers abundant solar incentives, including:
- The federal Investment Tax Credit (ITC) at 30%
- Self-Generation Incentive Program (SGIP) battery storage rebates
- Solar installation property tax exemptions
Net metering remains beneficial, though NEM 3.0 reduced export compensation, emphasizing the importance of consuming your generated power rather than grid export.
Installation Challenges
Simple roof installations cost less and deliver quicker payback versus systems requiring complex angles, shade management, or structural modifications. Residential solar design for complicated projects increases labor and materials, potentially extending payback duration.
Municipal Requirements
California’s solar-friendly regulations expedite permits and inspections, reducing delays and expenses common elsewhere. However, specific local codes, such as fire setback requirements, may limit system dimensions, affecting performance and savings. Understanding what permits are required to install a solar system in California can help streamline your installation process. Working with solar permit expediting services can further reduce delays and costs.
System Performance
Solar setups vary in effectiveness. A south-oriented, unshaded Southern California roof outperforms a shaded, west-facing Northern California installation. Using solar radiation data can help determine your system’s expected performance.
Power Usage
Higher energy consumption means greater bill offsets through solar generation. Heavy-use households achieve shorter payback periods than smaller, low-consumption homes.
Each home’s situation combines these factors differently. A 6kW San Francisco system might pay off in 5-6 years, while identical Fresno equipment could break even in 4-5 years, superior sunshine and reduced costs create significant differences.
California Solar Incentives: Payback Period Impact
California’s solar incentives significantly shorten payback periods, transforming substantial upfront investments into accessible opportunities. Here’s what’s available:
Federal Investment Tax Credit (ITC)
The federal ITC provides a 30% tax deduction on your solar system cost. A $20,000 installation yields $6,000 in immediate savings, reducing net cost to $14,000. This credit covers both solar panels and simultaneously-installed battery storage.
Visit Energy.gov for complete eligibility details and guidelines.
Self-Generation Incentive Program (SGIP)
California’s SGIP offers battery storage rebates with amounts varying by circumstance:
- Standard level: $200/kWh battery capacity
- Equity level: $850/kWh for qualifying low-income households
- Equity resiliency level: $1,000/kWh for high fire-risk areas or PSPS-affected residents
A 10kWh battery generates rebates from $2,000 to $10,000, substantially reducing upfront investment. Learn more about California solar panel incentives and tax credits through official state programs.
Net Energy Metering (NEM)
Despite NEM 3.0’s reduced export credit values, net metering continues offsetting costs by prioritizing self-consumption of solar power. Maximizing personal usage has become essential, making battery storage increasingly valuable. Recent research from UC Irvine highlights the importance of energy storage in California’s evolving solar landscape.
Property Tax Exemption
California exempts solar systems from property tax assessments. While solar can increase home value significantly, your tax bill remains unchanged. This exemption provides crucial advantages for homeowners seeking value enhancement without additional expenses.
Payback Acceleration Examples
Here’s a practical scenario:
- System cost: $18,000
- ITC reduction: -$5,400
- Net investment: $12,600
- Annual electricity savings: $2,100
- Payback duration (ITC only): 6 years
Adding SGIP rebate eligibility (approximately $3,000 for battery storage) could reduce payback to merely 4-5 years, enhancing investment appeal.
These incentives can trim 2-4 years from your payback period, making solar financially prudent for most California homeowners.

California Solar Panel Pricing Breakdown
Solar panel costs across California vary based on system dimensions, location, and additional components. Here’s a comprehensive pricing overview:
Per-Watt Pricing
California residents typically invest $2.28 to $3.14 per watt for solar panels, slightly below the $3.03 national average, making California solar more financially accessible.
Complete System Pricing
For standard 5kW systems:
- Pre-incentive range: $11,401 to $15,700
- Post-30% federal tax credit: $7,981 to $10,990
Pricing by System Dimensions (Post-Federal Tax Credit)
- 3kW: $4,788 to $6,599
- 5kW: $7,981 to $10,990
- 7kW: $11,173 to $15,386
- 10kW: $15,962 to $21,980
Geographic Price Variations
California solar installation costs fluctuate based on location. Metropolitan areas like Los Angeles or San Diego typically show higher labor expenses, while rural regions may see moderately lower installation costs. Local permitting fees ($200-$500) also influence final pricing. Working with Solar Permit Solutions can help navigate these regional variations.
Enhancement Components
Common system enhancements include:
- Battery storage: $7,000 to $15,000
- Monitoring equipment: $200 to $500
Understanding electrical fundamentals for your solar project helps ensure proper system integration and safety. If you’re interested in exploring alternative approaches, check out our guide on building your own home solar power system.
Extended Timeline Perspective
Initial costs may seem substantial, but long-term savings make solar a self-funding investment. A typical California 5kW system generates approximately $115,966 in savings across 25 years. Even with regional cost variations, returns are compelling.
Solar Permit Solutions
Need Solar Permit Plans?
Professional, permit-ready solar plan sets delivered fast. Residential and commercial projects across all 50 states.
Energy Rate Impact on California Solar Payback
California’s energy pricing strongly favors solar customers. Here’s the explanation:
Elevated Energy Pricing
California’s $0.29/kWh average electricity rate (and rising) ranks 4th nationally. San Diego experiences even steeper rates, exceeding $0.47/kWh. Higher rates translate to greater solar savings.
Consider this example:
- 6kW system generating 9,000 kWh yearly
- At $0.29/kWh: $2,610 annual savings
- At $0.47/kWh (San Diego pricing): $4,230 annual savings
Elevated local rates dramatically reduce payback periods, frequently down to 3-4 years in markets like San Diego.
Accelerated Payback
Let’s examine the numbers:
- Post-incentive system cost: $15,000
- California average annual savings: $2,610
- Average payback duration: 5.7 years
Contrast this with national averages showing approximately $1,530 annual savings, extending payback to nearly 10 years.
Time-of-Use (TOU) Rate Plans
TOU pricing enhances solar attractiveness. The mechanism:
- Utilities charge premium rates during peak periods (afternoon/evening)
- Solar systems produce maximum energy during these peak hours, minimizing expensive grid dependence
Example:
- Peak TOU pricing: $0.40/kWh
- Off-peak pricing: $0.20/kWh
If half your solar offsets peak rates, annual savings can jump by $315 (50% of 4,500 kWh x $0.20/kWh).
Extended Savings Timeline
California electricity rates climb 4.1% annually, among America’s steepest increases. Impact on your savings:
- Year 1 savings (9,000 kWh at $0.29/kWh): $2,610
- Year 10 savings (at $0.43/kWh): $3,870
- 25-year accumulated savings: $115,966
Comparison: Los Angeles vs. San Diego
- Los Angeles (LADWP pricing): $0.23/kWh; approximately 7-year payback
- San Diego (SDG&E pricing): $0.47/kWh; approximately 4-year payback
Elevated energy costs equal faster payback. For California residents, solar economics typically favor installation, particularly in high-rate markets like San Diego. The World Bank’s energy data shows how renewable energy adoption correlates with electricity pricing trends.

Calculating California Solar Payback Period
Determining your solar panel payback period in California requires multiple calculation steps. Each step clarifies your investment’s break-even timeline.
Step 1: Determine Net Investment
Begin by calculating your solar system’s total cost after incentives:
Example: 6kW system at $18,000
Deduct 30% ITC: $18,000 – $5,400 = $12,600 net investment
This adjusted figure forms your payback calculation foundation.
Step 2: Project Annual Energy Generation
Your system’s annual energy production depends on location and size factors. Resources like NREL’s PVWatts Calculator provide precise estimates:
Example: San Diego 6kW system producing 9,600 kWh annually
Factors including shading, orientation, and panel efficiency may slightly modify this figure. Proper wire management and conduit practices for solar systems ensure optimal energy production.
Step 3: Determine Annual Savings
Multiply your system’s annual energy generation by local electricity pricing:
9,600 kWh x $0.29 (California average) = $2,784 yearly savings
Adjust for regional variations, such as San Diego’s $0.47/kWh peak pricing, for customized estimates.
Step 4: Factor Inflation and System Degradation
Both electricity rate inflation and solar panel degradation influence long-term savings:
Inflation: California electricity rates historically increase 4.1% annually, boosting future savings:
- Year 1: $2,784
- Year 10: $3,734 (with inflation)
Degradation: Solar panels lose approximately 0.5%-0.8% efficiency yearly. By year 10, your system might generate 9,120 kWh versus 9,600 kWh initially.
Step 5: Calculate Payback Period
Divide your net investment by annual savings:
$12,600 / $2,784 = 4.53-year simple payback
For dynamic estimates, incorporate both inflation and degradation:
Savings increase with inflation while production decreases marginally over time.
Step 6: Include Maintenance Expenses
Factor occasional maintenance costs:
- Annual maintenance: $100-$300 yearly for cleaning and inspections
- Inverter replacement: $1,000-$2,500 every 10-15 years
These costs minimally impact calculations but deserve inclusion for precision. Understanding DC connector risks in PV systems helps prevent costly repairs.
Comprehensive Example with Adjustments
Complete scenario:
- Initial savings: $2,784 yearly
- Year 10 savings: $3,734 yearly (with inflation)
- Year 25 savings: $6,297 yearly (accounting for degradation and rate increases)
Considering all factors provides refined payback periods and clearer long-term value understanding.
Conclusion
California solar investment transcends financial calculation, it’s a lifestyle commitment aligning environmental responsibility, energy autonomy, and sustained savings. By leveraging the state’s abundant sunshine, strong incentives, and elevated energy costs, homeowners transform upfront expenses into profitable investments.
For many, solar’s appeal lies in concrete numbers: 5-10 year average payback periods, savings potentially exceeding $115,000 across 25 years, and substantial monthly utility bill reductions. Yet economics tell only part of the story. Solar power delivers independence from volatile energy markets, and battery storage additions provide outage protection, increasingly critical in California’s fire-susceptible regions.
Beyond personal advantages, solar adoption supports broader objectives: decreasing fossil fuel dependence and promoting cleaner energy futures. California has consistently led renewable energy efforts, and understanding California’s solar rules helps each new solar installation reinforce that leadership.
Ultimately, going solar reflects your values as much as your finances. Whether driven by savings potential, energy independence appeal, or desire for reduced carbon impact, California solar panels deliver across all dimensions. Whether you’re considering DIY solar panel installation or need commercial solar design services, the solar journey demands research and planning, but the rewards, financial, personal, and environmental, justify the investment.
For those interested in off-grid solutions, exploring off-grid solar system design options can provide complete energy independence. Browse our comprehensive solar blog for additional insights and resources, or explore our full range of solar services to find the right solution for your needs. The California Solar Consumer Protection Guide offers additional resources to help homeowners make informed decisions.
FAQs
- Annual inspections: $150-$300
- Cleaning sessions: $50-$100 (1-2 times yearly)
- Solar-only system: approximately 5 years
- Solar with battery: approximately 8-10 years
However, benefits like backup power and TOU optimization often justify batteries.
What’s a solar system’s expected lifespan?
Solar panels function 25-30 years, typically maintaining 80% efficiency after 25 years. Inverters last 10-15 years and may require one replacement during system lifetime. Learn more about California’s largest solar farm electricity generation to understand utility-scale performance.
Need Solar Permit Plans?
Professional, permit-ready solar plan sets delivered fast. Residential and commercial projects across all 50 states.
Frequently Asked Questions
Solar panels need minimal maintenance, costing approximately $100-$300 annually, including: Annual inspections: $150-$300 and Cleaning sessions: $50-$100 (1-2 times yearly).
Battery addition typically extends payback 3-5 years: Solar-only system: approximately 5 years and Solar with battery: approximately 8-10 years. However, benefits like backup power and TOU optimization often justify batteries.
Solar panels function 25-30 years, typically maintaining 80% efficiency after 25 years. Inverters last 10-15 years and may require one replacement during system lifetime.
Absolutely—solar increases property value and accelerates sales. A 6kW system can add roughly $22,000 to resale value, making it smart investment even without reaching break-even.
Yes, your credit score significantly affects solar financing options and ultimately your payback timeline. Higher credit scores (above 700) typically qualify for lower interest rates on solar loans, reducing monthly payments and overall system costs. Lower credit scores may result in higher interest rates or require cash purchases or leases. For example, a $15,000 solar loan at 4% interest versus 8% interest can add 1-2 years to your payback period due to increased financing costs.
NEM 3.0, implemented in April 2023, significantly reduced the compensation rate for excess solar energy exported to the grid—typically 75-80% lower than previous NEM 2.0 rates. Under NEM 3.0, export credits average $0.05-$0.08/kWh compared to the full retail rate of $0.25-$0.47/kWh under NEM 2.0. This change extends payback periods by 1-3 years for solar-only systems that export significant power. However, the impact is minimized by maximizing self-consumption through strategic energy use timing or adding battery storage. Systems designed to consume 80-90% of generated power during production hours see minimal payback extension, while those exporting 50% or more during low-value periods face longer payback timelines.
Adding an electric vehicle (EV) to your household dramatically improves solar economics and accelerates payback periods. A typical EV adds 3,000-5,000 kWh of annual electricity consumption, which translates to $870-$2,350 in additional yearly costs at California's average rates. If you size your solar system to cover EV charging, you're offsetting some of your highest electricity expenses—effectively fueling your vehicle for $0.03-$0.05 per kWh (the levelized cost of solar) versus $0.29-$0.47/kWh from the grid. For example, if you add a 3kW system expansion specifically for EV charging at a cost of $6,840 after incentives, and it offsets $1,200 in annual charging costs, your payback on the additional capacity is just 5.7 years.
SPS Editorial Team
Solar Permit Solutions
Solar Permit Solutions provides professional solar permit design services for residential, commercial, and off-grid installations across all 50 states. Our team ensures permit-ready plan sets delivered fast.
Related Articles
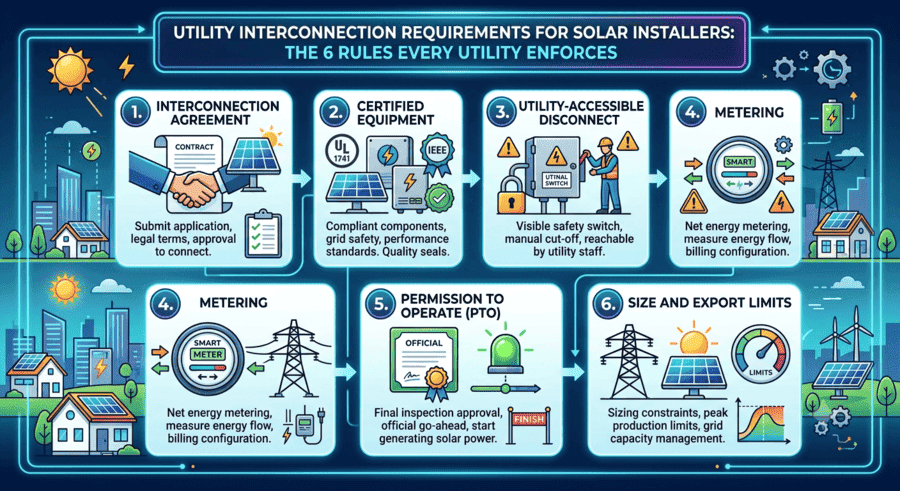
Utility Interconnection Requirements for Solar Installers: The 6 Rules Every Utility Enforces
interconnection agreement, UL 1741 and IEEE 1547 certified inverters, a utility-...

How to Respond to Solar Permit Corrections (And Get Approved on Resubmission)
To respond to a solar permit correction, read every comment from every reviewing...
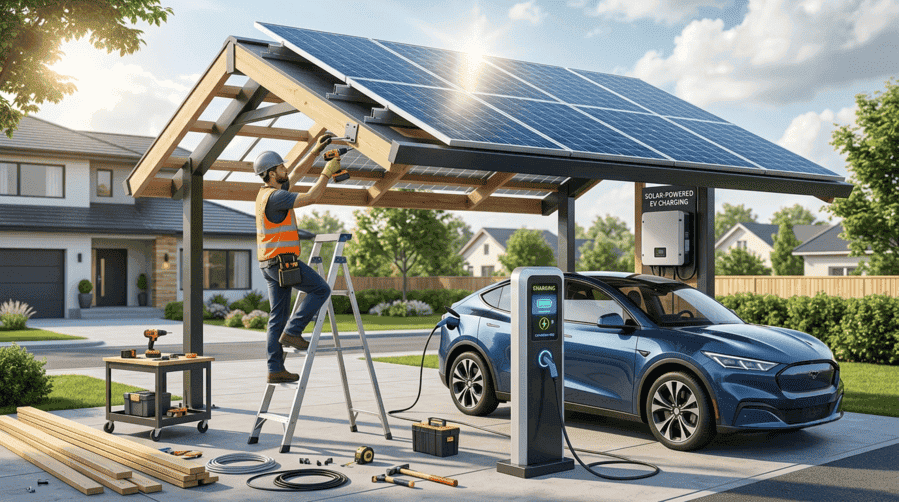
Can an EV Charging Station Be Powered by Solar? Here’s How to Build One
Yes, an EV charging station can be powered by solar. A grid-tied solar array pai...