
Solar and battery storage beat nuclear and natural gas for U.S. grid growth in 2025 because they’re cheaper, faster to build, and now provide reliable power through evening peaks. According to the U.S. Energy Information Administration, solar and storage account for 81% of all new U.S. power capacity this year, 63 GW total, with 32.5 GW from solar and 18.2 GW from battery storage. By comparison, natural gas adds just 4.4 GW, while no new nuclear capacity is expected. The economics are clear: utility-scale solar LCOE ranges from $38 to $212/MWh versus $141 to $220/MWh for nuclear, and solar projects deploy in 1-3 years compared to 10-15 years for nuclear plants.

How Much Solar + Storage Capacity Is the U.S. Adding?
The numbers tell a compelling story. In 2024, developers added a record 30 GW of utility-scale solar to the U.S. grid, accounting for 61% of all capacity additions. Battery storage followed with 10.3 GW, also a record. The momentum is accelerating in 2025.
2025 Capacity Additions by Technology
- Solar: 32.5 GW projected (up from 30 GW in 2024)
- Battery Storage: 18.2 GW projected (up 77% from 10.3 GW in 2024)
- Wind: 7.7 GW projected (up from 5.1 GW in 2024)
- Natural Gas: 4.4 GW projected
Texas leads the charge with 11.6 GW of planned solar capacity, followed by California (2.9 GW). Understanding Texas solar permit requirements is essential for developers targeting this high-growth market. Indiana, Arizona, Michigan, Florida, and New York each expect to add more than 1 GW of solar in 2025.
For battery storage, the growth trajectory is even steeper. U.S. battery capacity increased 59% year-over-year through late 2025, with California and Texas holding over 70% of the national total. An additional 22 GW of storage is projected for the next 12 months.
By the end of 2026, cumulative U.S. solar capacity is expected to reach 182 GW, double the 91 GW installed at the end of 2023. This represents a tripling of solar capacity in just three years.

Why Utilities Are Choosing Solar + Storage Over Fossil Fuels
The shift toward solar + storage isn’t ideological; it’s economic. Three primary factors are driving utility decisions: cost competitiveness, deployment speed, and federal incentives.
Cost Comparison: Levelized Cost of Energy (LCOE)
According to Lazard’s 2025 Levelized Cost of Energy+ report, utility-scale solar and onshore wind remain the most cost-competitive forms of new-build energy generation on an unsubsidized basis, even amid persistent low natural gas prices.
Unsubsidized LCOE Ranges (2025):
- Utility-Scale Solar: $38-$212/MWh
- Onshore Wind: $37-$86/MWh
- Combined Cycle Gas: $48-$109/MWh
- Nuclear: $141-$220/MWh
- Coal: $71-$173/MWh
The EIA’s Annual Energy Outlook 2025 confirms this: solar PV LCOE is lower than natural gas combined-cycle LCOE on average, and in most regions, even without tax credits. Compared to 2024, solar LCOE dropped another 4%.
Deployment Speed
Speed matters when utilities need new capacity quickly. Solar and battery projects can be permitted, built, and interconnected in 1-3 years. Natural gas plants typically require 3-5 years. Nuclear projects? The Vogtle Units 3 and 4 in Georgia took about 15 years from construction start (2009) to commercial operation (2023-2024), 7 years behind the original 2016-2017 schedule, and cost approximately $35 billion, more than double the original $14 billion estimate. Understanding how long it takes to get a solar permit helps developers plan realistic project timelines.
For utilities facing rising electricity demand from data centers, EV charging, and electrification, solar + storage offers the fastest path to new generation.
Inflation Reduction Act (IRA) Incentives
The Inflation Reduction Act of 2022 dramatically improved the economics of solar + storage through extended and expanded tax credits. The Department of Energy’s solar tax credit guide outlines the key provisions:
- Investment Tax Credit (ITC): 30% credit for qualifying solar and standalone battery storage projects through 2032
- Standalone Storage Eligibility: For the first time, battery storage qualifies for the ITC independently, without needing to be paired with solar
- Bonus Credits: Up to 10% additional credit for projects in energy communities or meeting domestic content requirements
- Direct Pay Option: Tax-exempt entities (municipalities, cooperatives) can now receive direct payments instead of tax credits
Note: Recent policy changes under the One Big Beautiful Bill have modified some IRA provisions. The residential solar tax credit (Section 25D) is set to expire December 31, 2025, while utility-scale projects face a 2027 placed-in-service deadline for certain credits. Homeowners can claim remaining credits using IRS Form 5695.

How Battery Storage Solved Solar’s Reliability Problem
For years, the most common criticism of solar energy was straightforward: “What happens when the sun goes down?” Utility-scale battery storage answered that question definitively.
The California Duck Curve Solution
California’s “duck curve” illustrates the challenge: solar generation peaks midday when demand is moderate but drops to zero as evening demand surges. This creates steep ramping requirements that traditionally required natural gas peaker plants. For projects in the Golden State, our guide to solar panel permitting in California covers the latest requirements.
Battery storage has fundamentally changed this dynamic. In April 2024, battery storage became the single largest source of supply in California during the evening peak for the first time, exceeding 6 GW of discharge, more than natural gas, hydro, nuclear, and renewables combined for approximately two hours.
Peak-hour battery discharge in California more than doubled year-over-year in 2024. The result: natural gas generation during evening peaks has effectively halved as batteries take control of ramp management.
Grid Services Batteries Provide
- Peak Shaving: Storing midday solar generation for release during evening demand peaks
- Frequency Regulation: Rapidly responding to grid frequency deviations to maintain stability
- Ramp Management: Smoothing the transition as solar generation rises in the morning and falls in the evening
- Capacity Firming: Ensuring solar resources can meet capacity obligations and resource adequacy requirements
The strategic cycle of charging batteries during peak solar production and discharging during peak demand has made solar + storage not just clean but genuinely reliable. For utilities, reliability is the metric that matters most. Proper system design requires understanding electrical panel types for solar interconnection and backup power configurations.
Solar Permit Solutions
Need Solar Permit Plans?
Professional, permit-ready solar plan sets delivered fast. Residential and commercial projects across all 50 states.
Why Fossil Fuel and Nuclear Projects Are Slowing Down
While solar + storage accelerates, traditional power sources face structural headwinds that make new construction increasingly difficult.
Nuclear: Chronic Cost Overruns and Delays
A 2025 study analyzing 662 energy infrastructure projects across 83 countries found that nuclear power plants have the highest construction risk of any technology, with an average cost overrun of 102.5%, typically costing $1.56 billion more than expected.
The Vogtle Units 3 and 4 in Georgia exemplify this pattern. Originally budgeted at $14 billion with completion expected in 2016-2017, the project ultimately cost over $31 billion to the owners (approximately $35 billion including contractor settlements) and wasn’t completed until 2023-2024. Construction timelines for U.S. nuclear plants have stretched from 4 years in the late 1960s to 10-15 years today.
An MIT study found that productivity in recent U.S. nuclear plants is up to 13 times lower than industry expectations, with “soft” costs (engineering, design, and scheduling) contributing over half of cost increases.
Natural Gas: Rising Costs and Uncertain Future
Natural gas capacity additions have declined significantly. In 2025, only 4.4 GW of new gas capacity is planned, compared to 50.7 GW of solar + storage. Key challenges include:
- Longer Permitting Timelines: Environmental reviews and community opposition have extended approval processes
- Fuel Price Volatility: While current gas prices are low, long-term price uncertainty creates financing challenges
- Investor and Public Pressure: ESG mandates and corporate sustainability commitments are shifting capital toward renewables
- Stranded Asset Risk: Gas plants built today may face early retirement as renewable costs continue declining
Notably, California’s decline in natural gas consumption occurred even as gas prices dropped from nearly $9/MMBtu in April 2023 to just $4/MMBtu in 2024, demonstrating that battery storage, not economics alone, is driving the shift.

Which States Are Leading Solar + Storage Growth?
Solar and storage deployment varies significantly by state, driven by solar resources, electricity prices, policy support, and grid needs. Our analysis of the average solar permit timeline by state shows approval times ranging from 25 to 64 days depending on jurisdiction.
Top States for 2025 Solar Capacity Additions
- Texas: 11.6 GW planned (leads nation by wide margin)
- California: 2.9 GW planned
- Indiana: 1+ GW planned
- Arizona: 1+ GW planned (APS customers can review specific requirements here)
- Michigan: 1+ GW planned
- Florida: 1+ GW planned
- New York: 1+ GW planned
Texas surpassed California in 2024 as the state with the most utility-scale solar capacity. The combination of abundant land, strong solar resources, a deregulated market (ERCOT), and streamlined permitting has made Texas the epicenter of U.S. solar development.
Battery Storage Leaders
California and Texas together hold over 70% of national battery storage capacity. California’s leadership stems from aggressive renewable portfolio standards and the need to manage the duck curve. Texas is rapidly catching up, with 7.0 GW of battery storage expected in 2025 alone.
Arizona has emerged as a third major market, driven by peak demand from air conditioning loads and excellent solar resources. States with notable solar job growth in 2024 included Ohio (5%), Georgia (4.5%), Utah (3.5%), and Texas (3%), demonstrating that solar deployment spans the political spectrum.
What This Means for the Solar Industry
The dominance of solar + storage in new capacity additions creates significant opportunities across the industry value chain.
Job Growth and Workforce Needs
According to the 2024 National Solar Jobs Census from IREC, the U.S. solar industry employed 280,119 workers in 2024, with an additional 93,497 workers in clean energy storage, totaling over 464,000 jobs across both sectors. Key workforce findings:
- Installation and project development account for nearly two-thirds of all solar jobs (178,713 positions)
- Manufacturing jobs totaled 32,491, with projections to reach 115,000 by 2030
- Clean storage jobs grew 4% year-over-year, adding 3,905 positions in 2024
- 57% of new solar jobs don’t require a bachelor’s degree
- To reach 30% solar by 2030, the industry needs to grow to over 1 million workers, according to SEIA workforce projections
Permitting and Design Demand
With 63 GW of new capacity planned for 2025 alone, demand for permitting, engineering, and design services is at record levels. Meeting solar engineering requirements for permits is essential for project success. This includes:
- Utility Interconnection Studies: Engineering analysis for grid connection (see our solar interconnection agreement guide)
- NEC Code Compliance: Electrical design meeting National Electrical Code requirements, including NEC 690.15 disconnecting means
- AHJ Permit Packages: Complete documentation for Authority Having Jurisdiction approval
- Battery Integration Design: DC-coupled and AC-coupled storage system engineering
The industry generated over $71 billion in private investment in 2024, according to SEIA’s solar industry research data. Major corporations, including Amazon, Google, and Meta, have contracted pipelines exceeding 25 GW combined, driving sustained demand for utility-scale development services.
Challenges Still Facing Solar + Storage Deployment
Despite record growth, significant obstacles remain that could slow the pace of solar + storage deployment.
Interconnection Queue Backlog
The most significant bottleneck is grid interconnection. According to Lawrence Berkeley National Laboratory’s Queued Up report, as of the end of 2024, nearly 2,300 GW of total generation and storage capacity were actively seeking connection to the grid, representing about 10,300 projects and nearly twice the country’s current installed capacity of 1,280 GW.
Key interconnection statistics:
- Active queue volume decreased 12% in 2024 due to high withdrawal rates
- Only 13% of capacity requesting interconnection from 2000 to 2019 reached commercial operation by end of 2024
- Median time from request to operation: over 4 years (up from under 2 years in 2000-2007)
- ~10,300 projects currently seeking interconnection
- 77% of capacity that entered queues from 2000 to 2019 was withdrawn
FERC Order 2023 implemented reforms including cluster-based processing (replacing first-come, first-served), higher deposits, stricter timelines, and penalties for missed deadlines. Understanding how solar panels connect to the grid helps developers navigate these requirements. However, implementation varies by region, and the backlog will take years to clear.
Supply Chain Constraints
While U.S. solar module production has grown from 8.5 GW to 15.5 GW capacity, upstream manufacturing (cells, ingots, wafers) remains limited. Tariff uncertainties and customs delays have periodically disrupted equipment availability, as demonstrated by recent furloughs at major domestic manufacturers.
Policy Uncertainty
Recent legislative changes have created uncertainty around tax credit availability and timelines. Developers can track current incentives through the DSIRE database of state incentives. Projects in the interconnection queue may struggle to meet policy deadlines.
Conclusion
The data is unambiguous: solar paired with battery storage is no longer an “alternative” energy source; it’s the primary driver of U.S. power sector growth. With 81% of new capacity additions, record-low costs, and the ability to provide reliable, dispatchable power, solar + storage has become the default choice for utilities, developers, and corporate buyers.
Challenges remain. Interconnection queues are backlogged with over 2,300 GW of projects waiting for grid access. Policy uncertainty continues to create planning difficulties. And the industry needs to scale its workforce to over 1 million workers to meet deployment goals. Streamlined permitting solutions like NREL’s SolarAPP+ are helping accelerate approvals, and professional residential solar design services ensure code compliance from the start.
But the trajectory is clear. Solar capacity is doubling every three years. Battery storage is growing 60%+ annually. And economics, not mandates, is driving utility decisions. For anyone working in solar permitting, design, engineering, installation, or manufacturing, this represents a generational opportunity.
The future U.S. grid will be cleaner, more distributed, and increasingly solar-powered. That future is arriving faster than most predicted, and it’s creating demand for skilled professionals who can design, permit, and build the infrastructure to support it.
FAQs
Why is solar with battery storage growing so fast?
Solar + storage has become the cheapest, fastest-to-deploy power generation technology. The levelized cost of solar is now lower than natural gas in most regions, battery costs have declined over 80% in the past decade, and federal tax credits provide up to 30-50% cost reduction. Combined with rising electricity demand and corporate sustainability commitments, utilities are choosing solar + storage as the default option for new capacity.
How much does utility-scale solar cost per MWh?
According to Lazard’s 2025 analysis, unsubsidized utility-scale solar LCOE ranges from $38 to $212/MWh, with the wide range reflecting location-specific factors like solar irradiance and land costs. The EIA projects capacity-weighted average LCOE around $30/MWh when including federal tax credits. For comparison, combined cycle natural gas ranges from $48 to $109/MWh and nuclear from $141 to $220/MWh.
How long does it take to build a solar farm with battery storage?
Construction of a utility-scale solar + storage project typically takes 12-18 months once permits and interconnection agreements are secured. However, the interconnection queue process now averages over 4 years for projects reaching commercial operation, making total development timelines 3-6 years from initial project inception. Understanding solar permission to operate requirements is essential for the final approval stage.
What percentage of new U.S. power plants are solar?
Solar accounts for over 50% of all new U.S. generating capacity additions in 2025. When combined with battery storage, the share rises to 81%. This marks a fundamental shift from 2002, when natural gas represented 57 GW of the 58 GW added that year.
Will solar be cheaper than natural gas in 2025?
Yes, for new-build generation. The EIA’s Annual Energy Outlook 2025 confirms that solar PV LCOE is lower than natural gas combined-cycle LCOE on average, even without tax credits in most regions. When including the 30% ITC, solar’s cost advantage becomes substantial. However, existing fully depreciated gas plants can still produce electricity at marginal costs below new solar, one reason why solar is displacing new gas construction rather than immediately replacing existing gas capacity.
How do batteries store solar energy for nighttime use?
Utility-scale lithium-ion batteries charge during midday hours when solar generation exceeds demand, storing DC electricity chemically. As the sun sets and demand rises, inverters convert stored DC power back to AC and discharge it to the grid. Modern 4-hour battery systems can store enough energy to cover evening peak demand periods, while longer-duration storage technologies are emerging for overnight and multi-day storage needs. For standalone applications, explore our off-grid solar system design services.
What federal incentives are available for solar + storage projects?
The Investment Tax Credit (ITC) provides a 30% credit for qualifying utility-scale and commercial solar + storage projects, with potential bonuses of 10% each for domestic content and energy community locations. The Production Tax Credit (PTC) offers ~2.75 cents/kWh for qualifying generation. Standalone battery storage became ITC-eligible under the Inflation Reduction Act. All projects must meet solar panel safety codes, including rapid shutdown requirements. Note: Recent policy changes have modified credit availability and timelines, consult current IRS guidance for specific project eligibility.
Need Solar Permit Plans?
Professional, permit-ready solar plan sets delivered fast. Residential and commercial projects across all 50 states.
SPS Editorial Team
Solar Permit Solutions
Solar Permit Solutions provides professional solar permit design services for residential, commercial, and off-grid installations across all 50 states. Our team ensures permit-ready plan sets delivered fast.
Related Articles
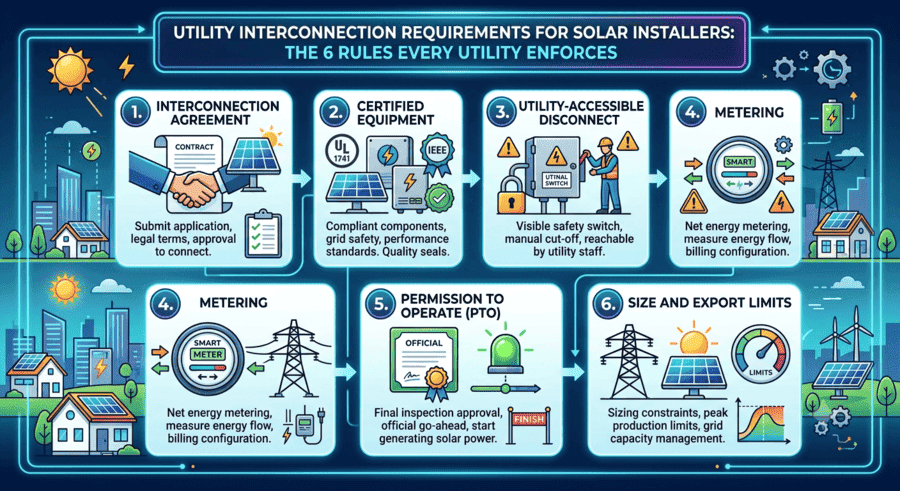
Utility Interconnection Requirements for Solar Installers: The 6 Rules Every Utility Enforces
interconnection agreement, UL 1741 and IEEE 1547 certified inverters, a utility-...

How to Respond to Solar Permit Corrections (And Get Approved on Resubmission)
To respond to a solar permit correction, read every comment from every reviewing...
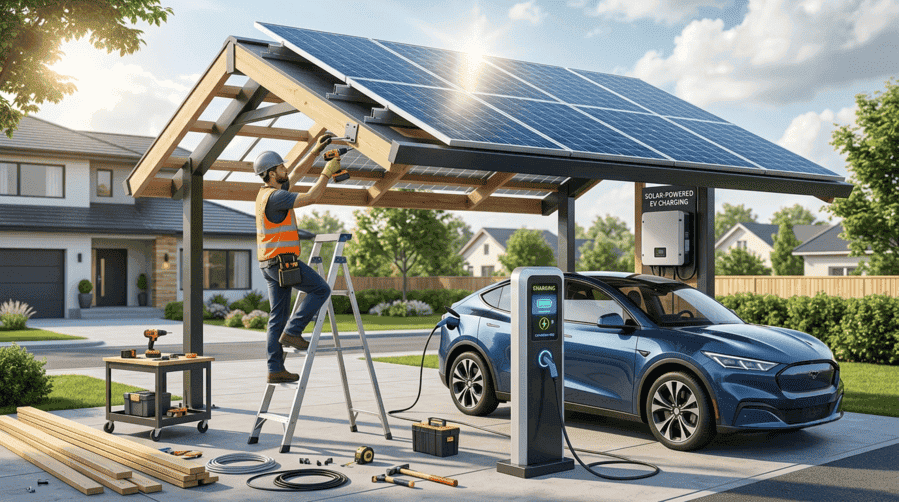
Can an EV Charging Station Be Powered by Solar? Here’s How to Build One
Yes, an EV charging station can be powered by solar. A grid-tied solar array pai...